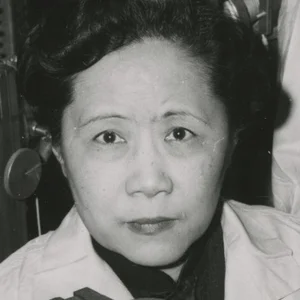

Marie Tharp was an American geologist and cartographer who produced the first scientific maps of the ocean floor. By mapping the Mid-Atlantic Ridge, she provided decisive visual proof of the theory of continental drift — long overlooked because of her status as a woman.
Marie Tharp(1920 — 2006)
Marie Tharp
États-Unis
8 min read
Frequently asked questions
Key Facts
- 1948: Joins the Lamont Geological Observatory at Columbia University, where she begins mapping the ocean floor
- 1952: Discovers the Rift Valley at the center of the Mid-Atlantic Ridge, a key piece of evidence for plate tectonics
- 1977: Publishes with Bruce Heezen the panoramic world map of the ocean floors, released by National Geographic
- 2001: Named by the Library of Congress as one of the four greatest cartographers of the 20th century
- Long excluded from ocean voyages because women were considered “bad luck” aboard research vessels
Works & Achievements
First detailed scientific map of the Mid-Atlantic Ridge, revealing the central rift valley. This work provided the decisive cartographic evidence for continental drift.
Major publication in the Special Papers of the Geological Society of America, describing for the first time the complete structure of mid-ocean ridges and their geodynamic significance.
Extension of the cartographic work to the third major oceanic basin in the world, confirming the universality of the mid-ocean ridge system.
Mapping of the world's largest ocean, completing alongside the Atlantic and Indian a global vision of Earth's submarine relief.
Cartographic masterpiece depicting the entirety of the world's ocean floors. Distributed by the National Geographic Society, this map became one of the most reproduced scientific images of the 20th century.
Anecdotes
When Marie Tharp presented Bruce Heezen with her first maps revealing a rift valley at the center of the Mid-Atlantic Ridge, he dismissed her work with a wave of his hand, declaring it was 'girl talk'. It took two years and additional seismic data before he admitted she was right and that the discovery confirmed continental drift.
Marie Tharp was not allowed to board Columbia University's research vessels in the 1950s, as superstitious maritime tradition held that the presence of women on board was a bad omen. She therefore worked on land, turning the sounding data brought back by her male colleagues into maps, reconstructing underwater landscapes she would never see with her own eyes.
Her monumental map of the ocean floor, published in 1977 with Bruce Heezen and edited by the National Geographic Society, was so accurate and aesthetically striking that it was hung in millions of classrooms around the world. Painter Heinrich Berann gave it a unique artistic dimension, but the scientific data came entirely from Marie Tharp.
In 1952, while methodically plotting bathymetric profiles of the North Atlantic, Marie Tharp noticed that the ocean floor displayed a repeated V-shaped structure, identical to a volcanic rift valley. This observation, drawn from miles of sonar data, would provide the missing geographical evidence for the theory of plate tectonics, long dismissed by the scientific community.
It was not until 1998, nearly fifty years after her landmark discovery, that Marie Tharp received official recognition: the Library of Congress named her one of the four most important cartographers of the 20th century. She had spent decades in the shadow of her male colleagues before her foundational role was fully acknowledged.
Primary Sources
This panoramic map of the ocean floor, produced by Marie Tharp and Bruce Heezen with illustrator Heinrich Berann, depicts for the first time the entire global submarine relief with scientific precision. It reveals the mid-ocean ridge system extending over 65,000 km.
"I just had to do the work. Draw the profiles, over and over, until the truth appeared in the data. The ocean floors don't lie."
Marie Tharp describes the process of compiling bathymetric data and emphasizes the need for a representation that is both scientifically rigorous and visually accessible to the general educational public.
The authors describe the mid-ocean ridge system and the central rift valley as a continuous, dynamic structure, consistent with a model of seafloor spreading.
Key Places
Laboratory where Marie Tharp worked from 1948 to 1982. It is here that she drew her revolutionary maps of the ocean floors, based on data collected by Bruce Heezen's ships.
Underwater mountain range extending from north to south across the Atlantic, whose central rift valley Marie Tharp discovered — decisive proof of seafloor spreading.
Marie Tharp's hometown, where she was born on July 30, 1920. Her father, a soil cartographer, passed on to her from childhood a love of maps and the representation of territory.
Town where Marie Tharp spent her final years and where she passed away in 2006. She kept her cartographic archives there until their donation to the Library of Congress.
Institution that holds Marie Tharp's cartographic archives and which, in 1998, officially named her one of the four most important cartographers of the 20th century.
Liens externes & ressources
Références
Œuvres
Carte de la dorsale médio-atlantique
1957
The Floors of the Oceans (avec Bruce Heezen et Maurice Ewing)
1959
Carte du fond de l'océan Indien
1964
Carte du fond de l'océan Pacifique
1969
World Ocean Floor Panorama (avec Bruce Heezen et Heinrich Berann)
1977